New Interactive Timescale
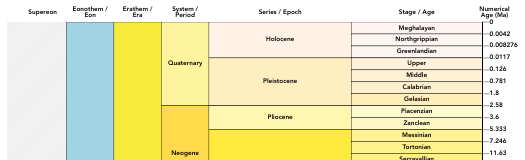
We are pleased to announce a new, interactive, version of the International Chronostratigraphic Chart! Students and staff at the Geological Survey of Queensland and the CSIRO have produced this version of the chart which uses data from its Semantic Web representation. This allows users to click on parts of the chart to return information in a user-friendly operation. Links in the returned page can be further followed to other parts of the chart.
The chart can be re-scaled using time, scaled as per the static chart, or logarithmic and even linear time. This aids in comparing the relative lengths of the time periods.
You can easily host a copy of this interactive chart online elsewhere, just visit the the underlying code repository for details.