Correlation Tables
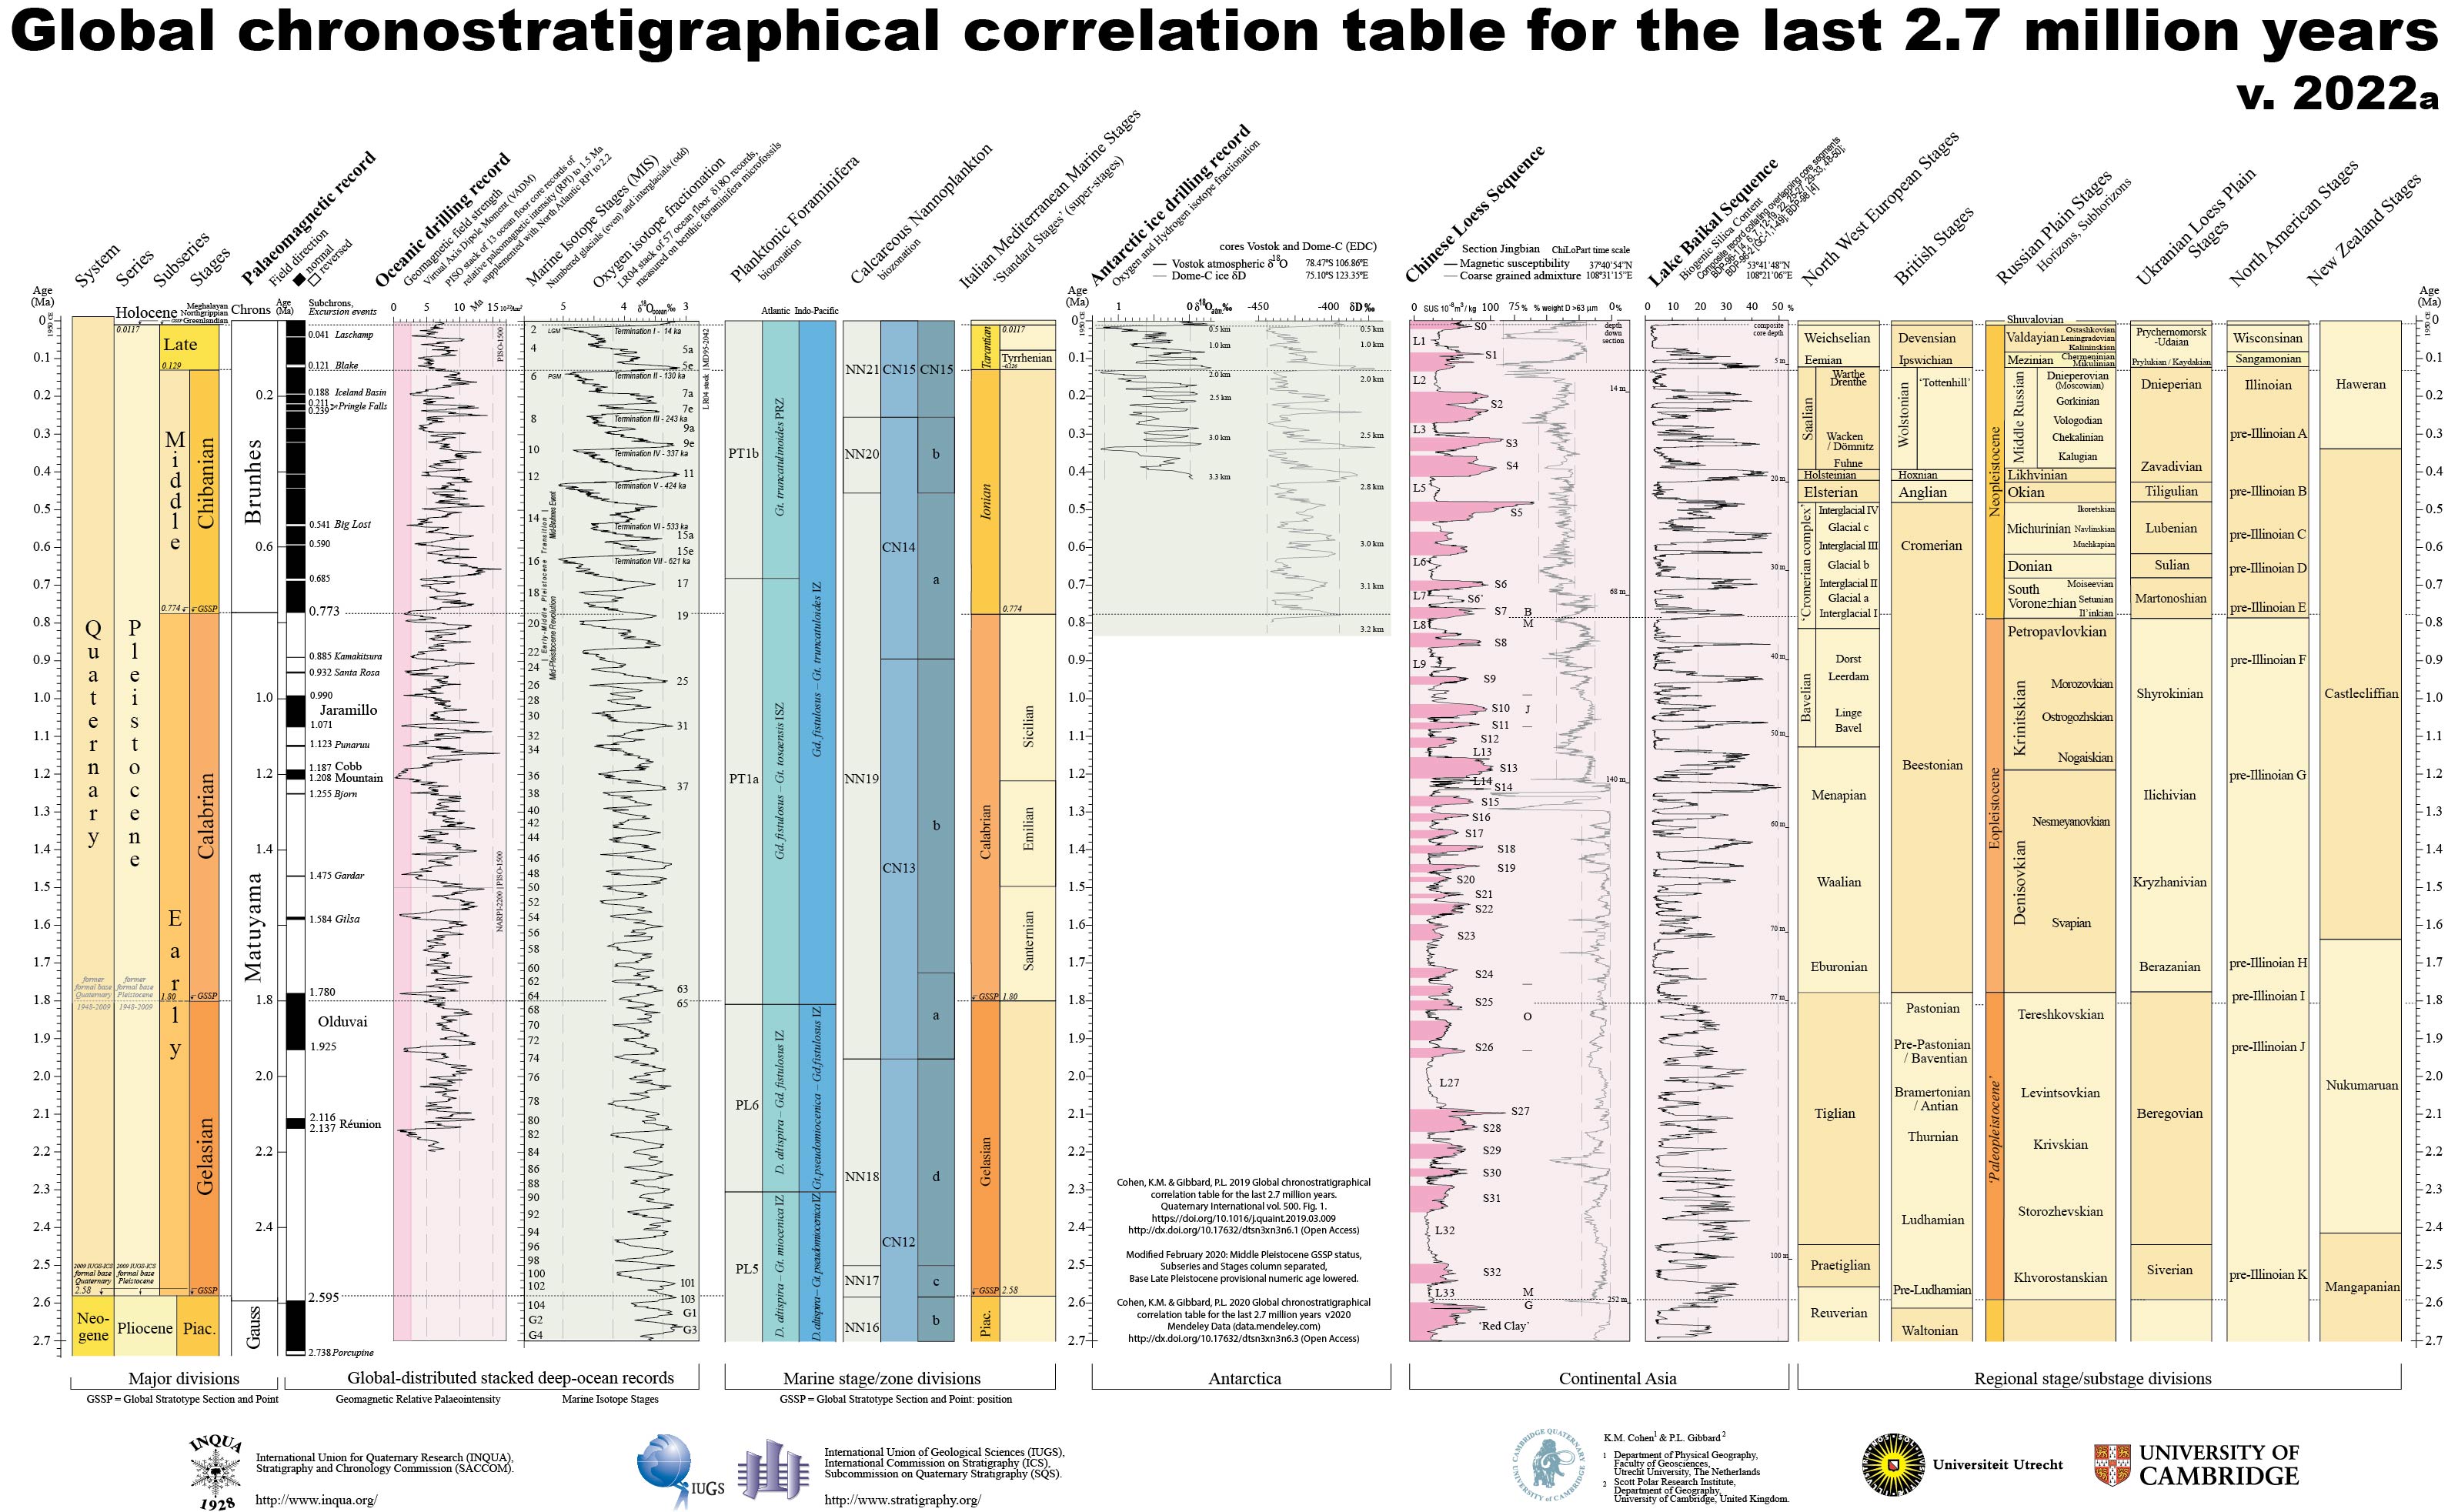
Global chronostratigraphical correlation table for the last 2.7 million years
Click here to download the pdf file and here to see the explanation of the correlation table.
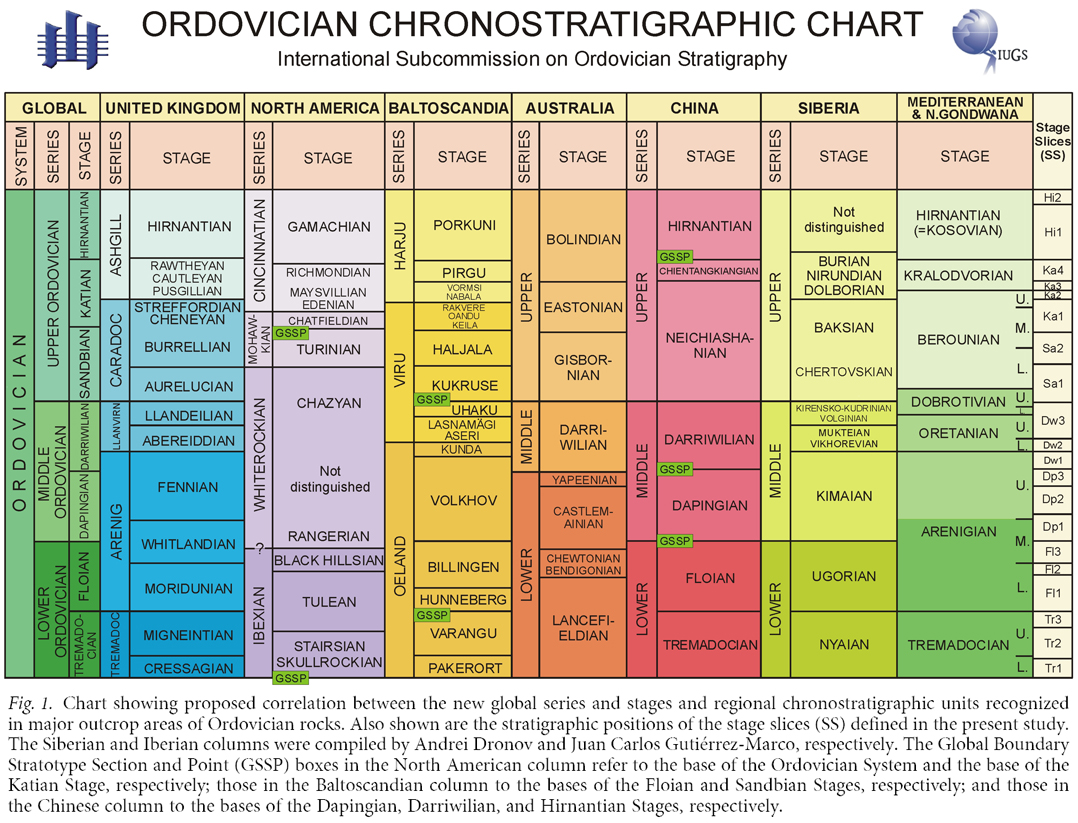
Ordovician Chronostratigraphic Chart
Showing correlation of regional chronostratigraphic schemes with the new global stages and series for the Ordovician System.
By Bergstrom, S.M., Xu Chen, Gutierrez-Marco, J.C., and Dronov, A., 2008, Lethaia, DOI 10.1111/j.1502-3931.2008.00136.x
Click HERE to download a better version (higher resolution)
Ordovician Carbon Isotope Curve
By Bergstrom, S.M., Xu Chen, Gutierrez-Marco, J.C., and Dronov, A., 2008, Lethaia, DOI 10.1111/j.1502-3931.2008.00136.x
Click HERE to download a better version (higher resolution)

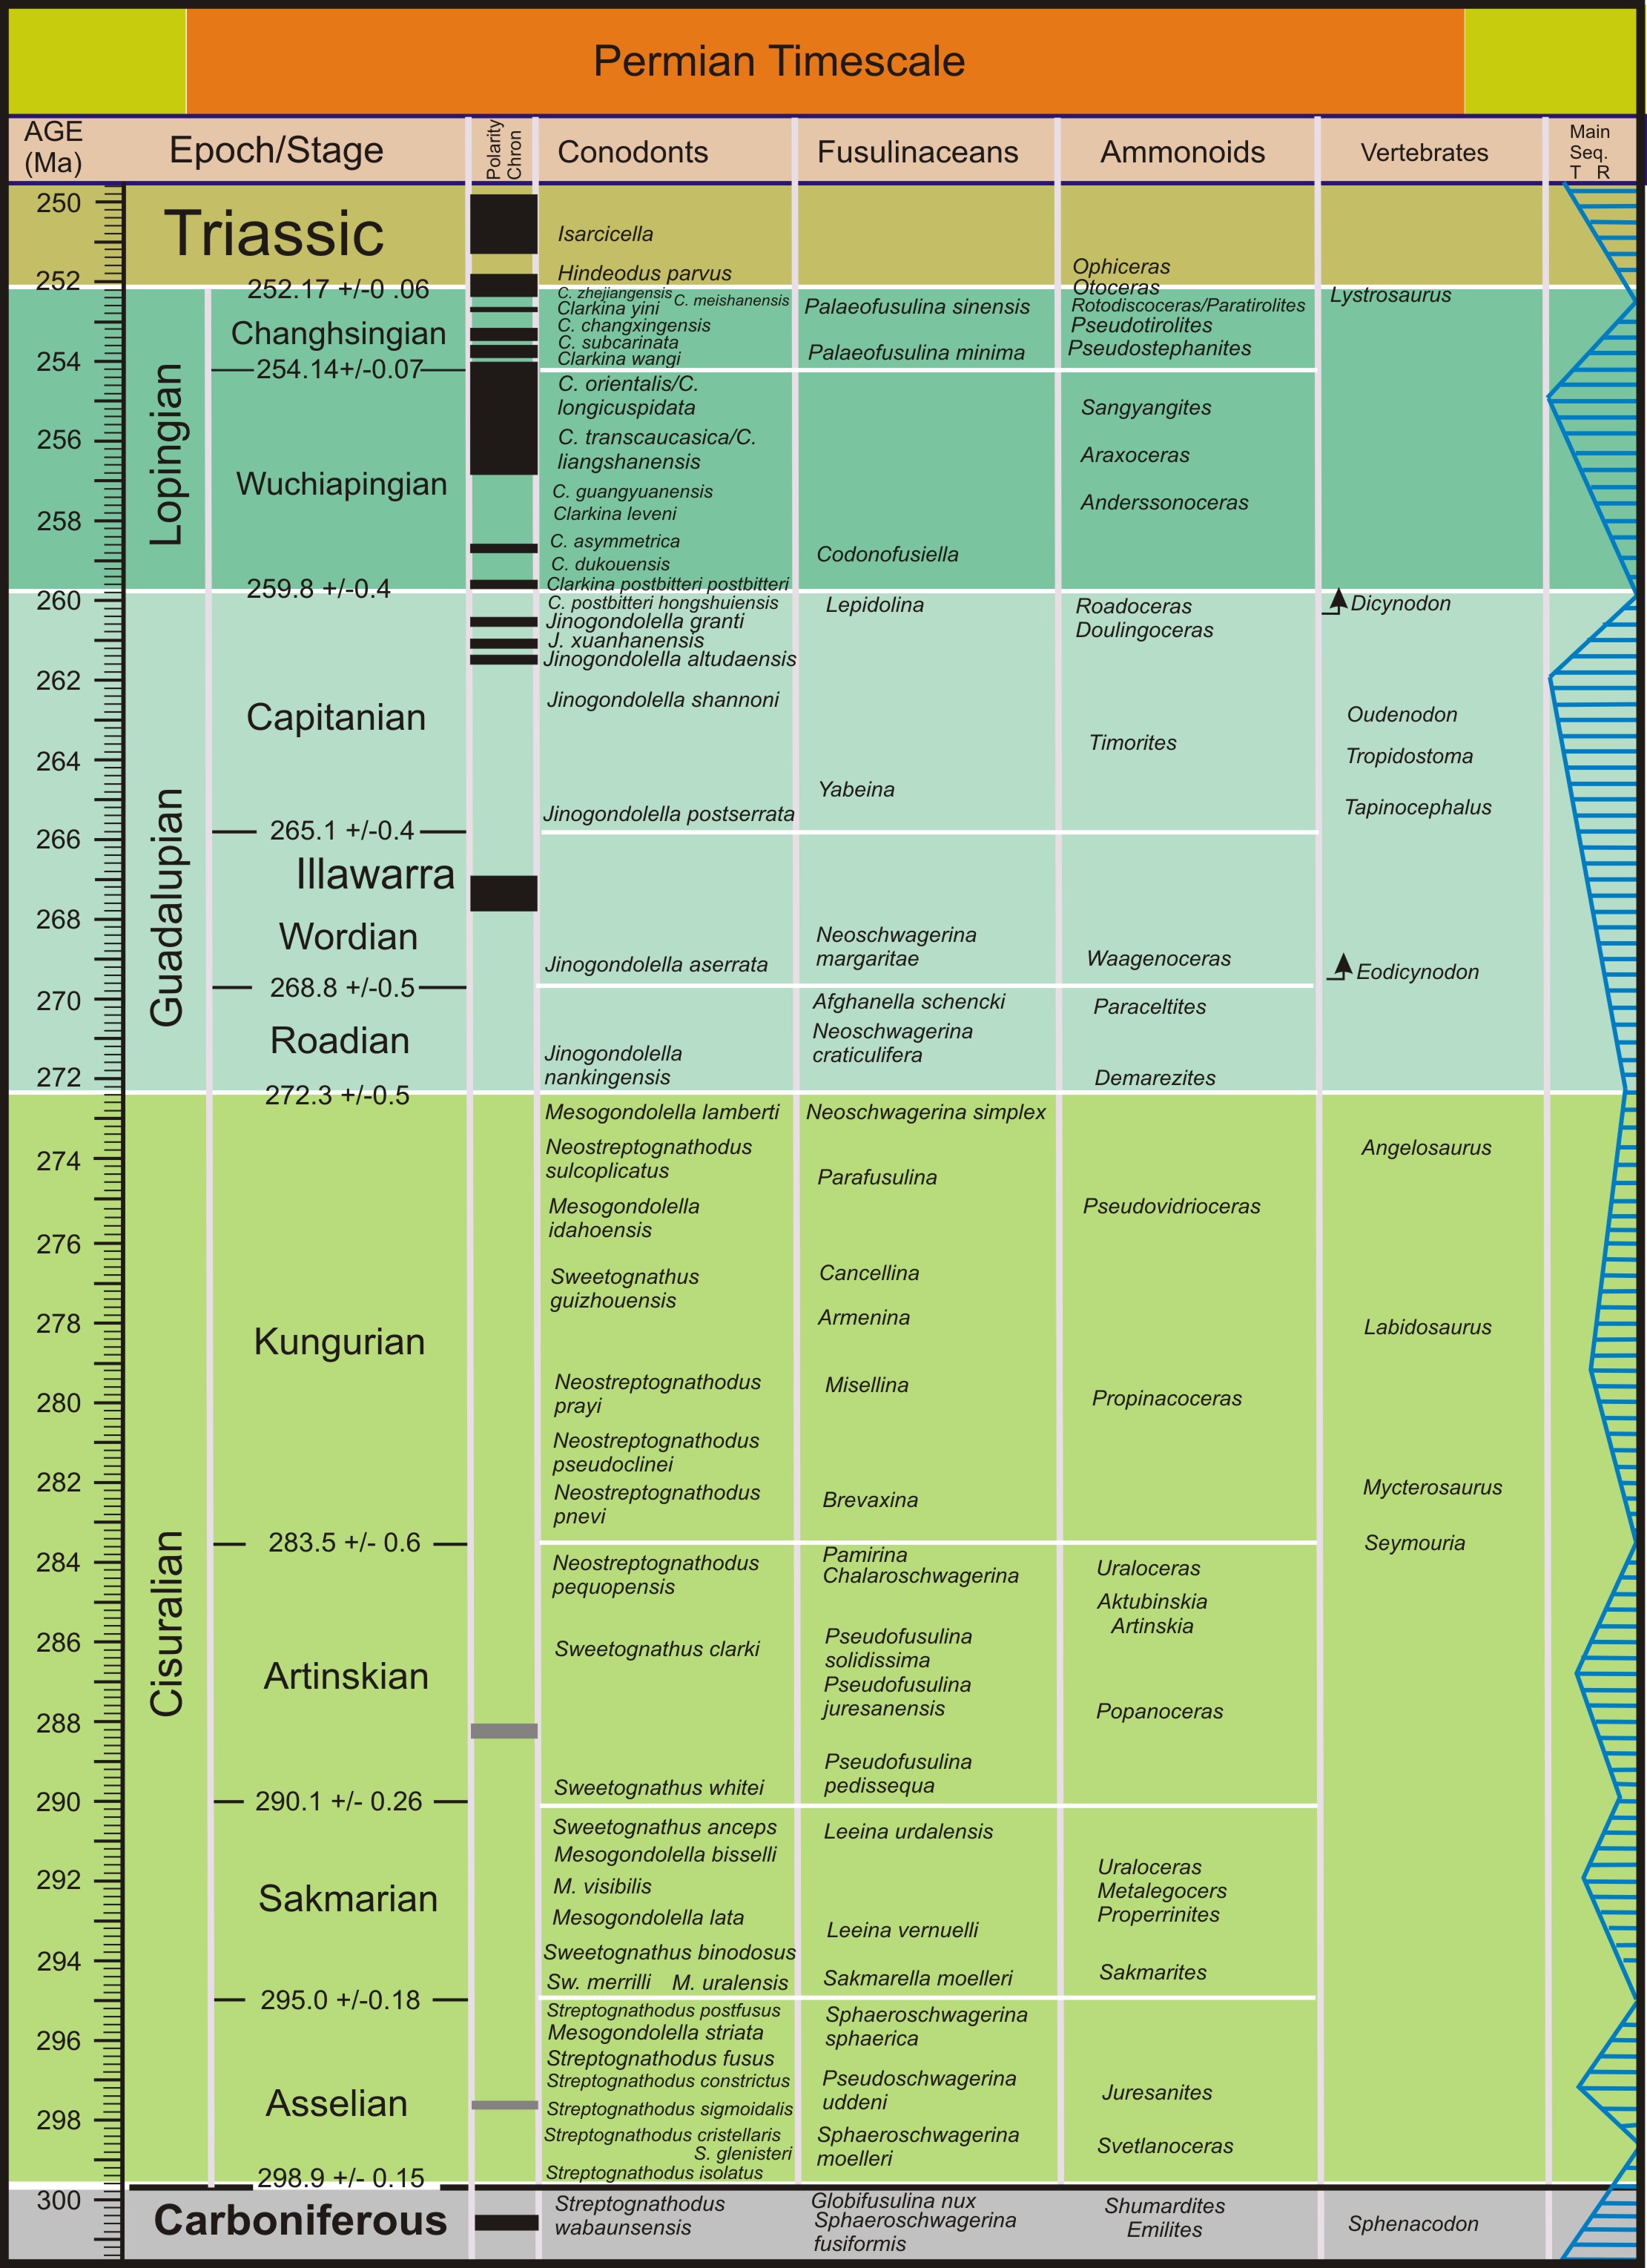
Permian Time Scale 2012
By Shen S.Z. et al.
Click HERE to download a better version (higher resolution)